The Item Summary is a visual, interactive tool that gives a breakdown of the menu items you have sold in the past. The Item Summary is a valuable tool to analyze sales of one specific item or a group of items. The information is presented in both table and chart formats, and you can print it in report form. This screen is highly customizable: you can change the information displayed to suit your specific needs, and then save your custom view to use again.
To View the Item Summary
1.Go to Today> Today's Tools> Item Summary. 
2.The date range shown is indicated below the toolbar and shown in the top-level column headings.

|
Note When viewing dates, be aware that the figures shown are for "business days." A business day encompasses the time from the first order entry until the completion of the End of Day process. So, one day on the summary could include sales made over two calendar days, for example, sales made on Friday Jan. 2 might include sales made from 10:00 am Jan. 2 through 2:00 am Jan. 3.
|
3.To load a previously-saved custom summary view, in the Saved View list at the far right, select a named view.
4.In the table, click the expand buttons  to see items or sizes within the categories.

|
Hint To increase viewing space by hiding the side menu, on the Edit menu, click Full Screen.
|
To Customize the Item Summary
1.Go to Today> Today's Tools> Item Summary. 
2.Click the links below to see instructions for customizing the item information shown.
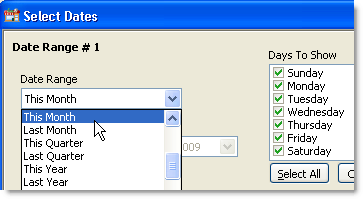
1.On the Item Summary toolbar, click the Date Range button.  2.The Select Dates window opens. In the Date Range list, do one of the following: •Select one of the pre-defined ranges from the list. -or-
•To enter a custom range, click Selected Dates, and then in the Start and End fields, select dates to define the start and end of the range. 3.In the Days to Show field, select the check boxes beside the days of the week to show in the summary. 4.Do one of the following: •To show this range only, click OK. Items for the selected range are shown in the table and chart. -or-
•To add another date range for comparison purposes, click Compare To, select the date range and days to show for the new range, and then click OK. Items for the date ranges you are comparing are shown in the table and chart. |
•On the Item Summary toolbar, click the arrow beside the Group By list  and select a grouping type. and select a grouping type.
The grouping type selected determines what is shown in the top-level table rows. For example, if Category/Item/Size is selected, each category will be shown on a separate row in the table. Clicking the expand buttons  will show the items within each category and then the sizes for each item. will show the items within each category and then the sizes for each item.
|
•On the summary toolbar, click the arrow beside the Summarize By list  and select a summary time period. and select a summary time period.
The grouping type selected determines what time period is shown in the table columns and the chart bars or lines. oDay: Shows each day as one column in the table. oWeek: Shows each week as one column in the table. oMonth: Shows each month as one column in the table. oYear: Shows each year as one column in the table. oSelected Periods: Creates one column for each date range you have selected for comparison (see Change the Dates Shown in the Summary, above, to select date ranges). |
1.On the summary toolbar, click the drop-down arrow beside the Selected Columns list.
2.Select the check boxes beside the sales figures you want to display for the item or category: •Quantity: the number sold. •Value: the gross dollar value sold (based on menu prices), before taxes or discounts are applied. •Sales Percent: the percentage of total sales dollars. |
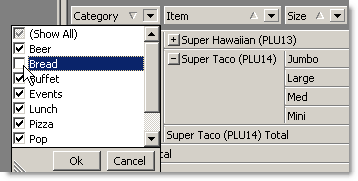
1.On the summary toolbar, click the drop-down arrow beside the Item, Category, or Size list. The categories, items, and sizes in your menu are listed.
2.Clear the check box beside a category, item or size to remove it from the summary, and then click Ok. |
To Save Your Customized Summary View
1.Go to Today> Today's Tools> Item Summary. 
2.Make changes to the summary to customize it for your operation (see To Customize the Item Summary, above).
3.Click the Save button  on the toolbar.
4.In the Save View As field, enter a name for your custom view, and click OK. The custom view is shown in the Select View list and can be selected at any time.
See also:
•View the Sales Summary
•Export Sales and Item Summaries
•Print Sales and Item Summaries

![]()

 to see items or sizes within the categories.
![]()


![]()
 on the toolbar.


